|
--- |
|
language: en |
|
tags: |
|
- transformers |
|
- text-classification |
|
- taxonomy |
|
license: other |
|
license_name: link-attribution |
|
license_link: https://dejanmarketing.com/link-attribution/ |
|
model_name: Taxonomy Classifier |
|
pipeline_tag: text-classification |
|
base_model: albert-base-v2 |
|
--- |
|
|
|
# Taxonomy Classifier |
|
|
|
This model is a hierarchical text classifier designed to categorize text into a 7-level taxonomy. It utilizes a chain of models, where the prediction at each level informs the prediction at the subsequent level. This approach reduces the classification space at each step. |
|
|
|
## Model Details |
|
|
|
- **Model Developers:** [DEJAN.AI](https://dejan.ai/) |
|
- **Model Type:** Hierarchical Text Classification |
|
- **Base Model:** [`albert/albert-base-v2`](https://huggingface.co/albert/albert-base-v2) |
|
- **Taxonomy Structure:** |
|
|
|
| Level | Unique Classes | |
|
|---|---| |
|
| 1 | 21 | |
|
| 2 | 193 | |
|
| 3 | 1350 | |
|
| 4 | 2205 | |
|
| 5 | 1387 | |
|
| 6 | 399 | |
|
| 7 | 50 | |
|
|
|
- **Model Architecture:** |
|
- **Level 1:** Standard sequence classification using `AlbertForSequenceClassification`. |
|
- **Levels 2-7:** Custom architecture (`TaxonomyClassifier`) where the ALBERT pooled output is concatenated with a one-hot encoded representation of the predicted ID from the previous level before being fed into a linear classification layer. |
|
- **Language(s):** English |
|
- **Library:** [Transformers](https://huggingface.co/docs/transformers/index) |
|
- **License:** [link-attribution](https://dejanmarketing.com/link-attribution/) |
|
|
|
## Uses |
|
|
|
### Direct Use |
|
|
|
The model is intended for categorizing text into a predefined 7-level taxonomy. |
|
|
|
### Downstream Uses |
|
|
|
Potential applications include: |
|
|
|
- Automated content tagging |
|
- Product categorization |
|
- Information organization |
|
|
|
### Out-of-Scope Use |
|
|
|
The model's performance on text outside the domain of the training data or for classifying into taxonomies with different structures is not guaranteed. |
|
|
|
## Limitations |
|
|
|
- Performance is dependent on the quality and coverage of the training data. |
|
- Errors in earlier levels of the hierarchy can propagate to subsequent levels. |
|
- The model's performance on unseen categories is limited. |
|
- The model may exhibit biases present in the training data. |
|
- The reliance on one-hot encoding for parent IDs can lead to high-dimensional input features at deeper levels, potentially impacting training efficiency and performance (especially observed at Level 4). |
|
|
|
## Training Data |
|
|
|
The model was trained on a dataset of 374,521 samples. Each row in the training data represents a full taxonomy path from the root level to a leaf node. |
|
|
|
## Training Procedure |
|
|
|
- **Levels:** Seven separate models were trained, one for each level of the taxonomy. |
|
- **Level 1 Training:** Trained as a standard sequence classification task. |
|
- **Levels 2-7 Training:** Trained with a custom architecture incorporating the predicted parent ID. |
|
- **Input Format:** |
|
- **Level 1:** Text response. |
|
- **Levels 2-7:** Text response concatenated with a one-hot encoded vector of the predicted ID from the previous level. |
|
- **Objective Function:** CrossEntropyLoss |
|
- **Optimizer:** AdamW |
|
- **Learning Rate:** Initially 5e-5, adjusted to 1e-5 for Level 4. |
|
- **Training Hyperparameters:** |
|
- **Epochs:** 10 |
|
- **Validation Split:** 0.1 |
|
- **Validation Frequency:** Every 1000 steps |
|
- **Batch Size:** 38 |
|
- **Max Sequence Length:** 512 |
|
- **Early Stopping Patience:** 3 |
|
|
|
## Evaluation |
|
|
|
Validation loss was used as the primary evaluation metric during training. The following validation loss trends were observed: |
|
|
|
- **Level 1, 2, and 3:** Showed a relatively rapid decrease in validation loss during training. |
|
- **Level 4:** Exhibited a slower decrease in validation loss, potentially due to the significant increase in the dimensionality of the parent ID one-hot encoding and the larger number of unique classes at this level. |
|
|
|
Further evaluation on downstream tasks is recommended to assess the model's practical performance. |
|
|
|
## How to Use |
|
|
|
Inference can be performed using the provided Streamlit application. |
|
|
|
1. **Input Text:** Enter the text you want to classify. |
|
2. **Select Checkpoints:** Choose the desired checkpoint for each level's model. Checkpoints are saved in the respective `level{n}` directories (e.g., `level1/model` or `level4/level4_step31000`). |
|
3. **Run Inference:** Click the "Run Inference" button. |
|
|
|
The application will output the predicted ID and the corresponding text description for each level of the taxonomy, based on the provided `mapping.csv` file. |
|
|
|
## Visualizations |
|
|
|
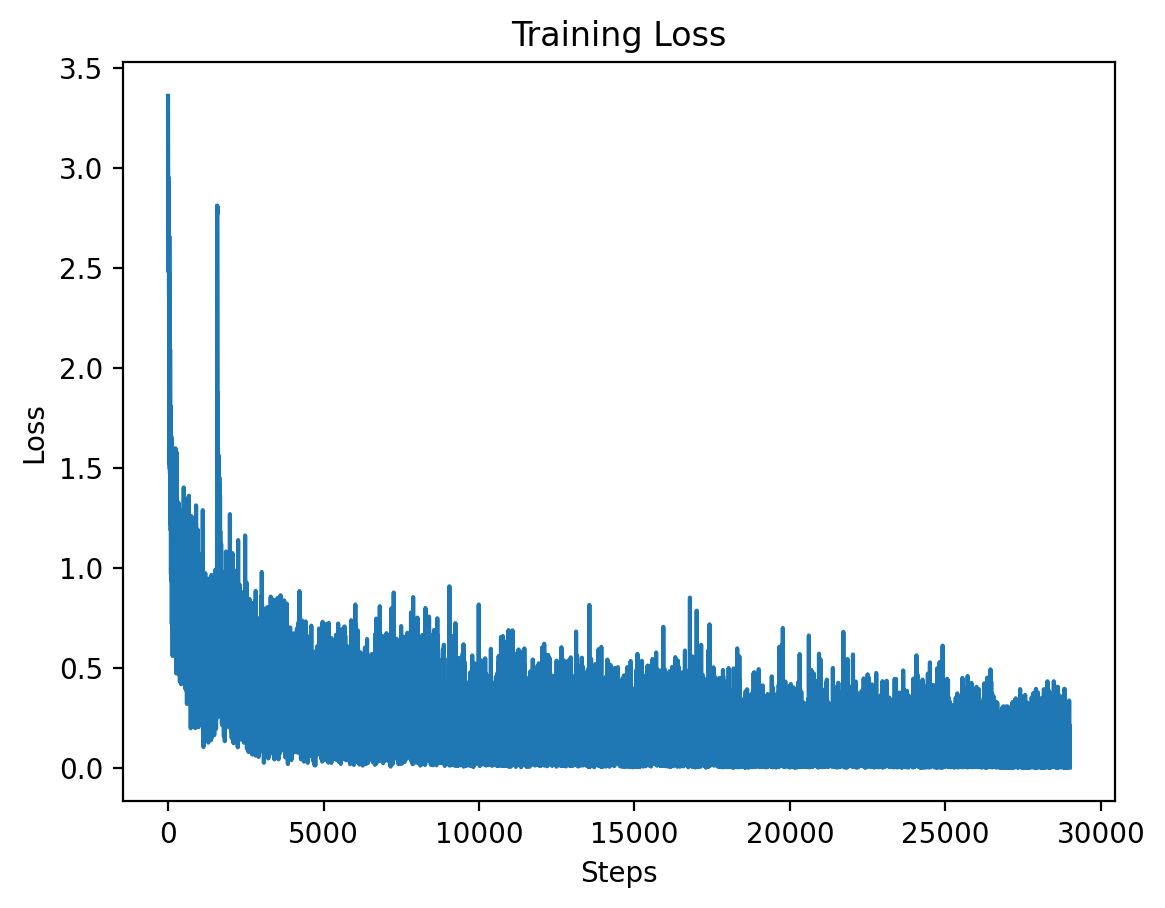
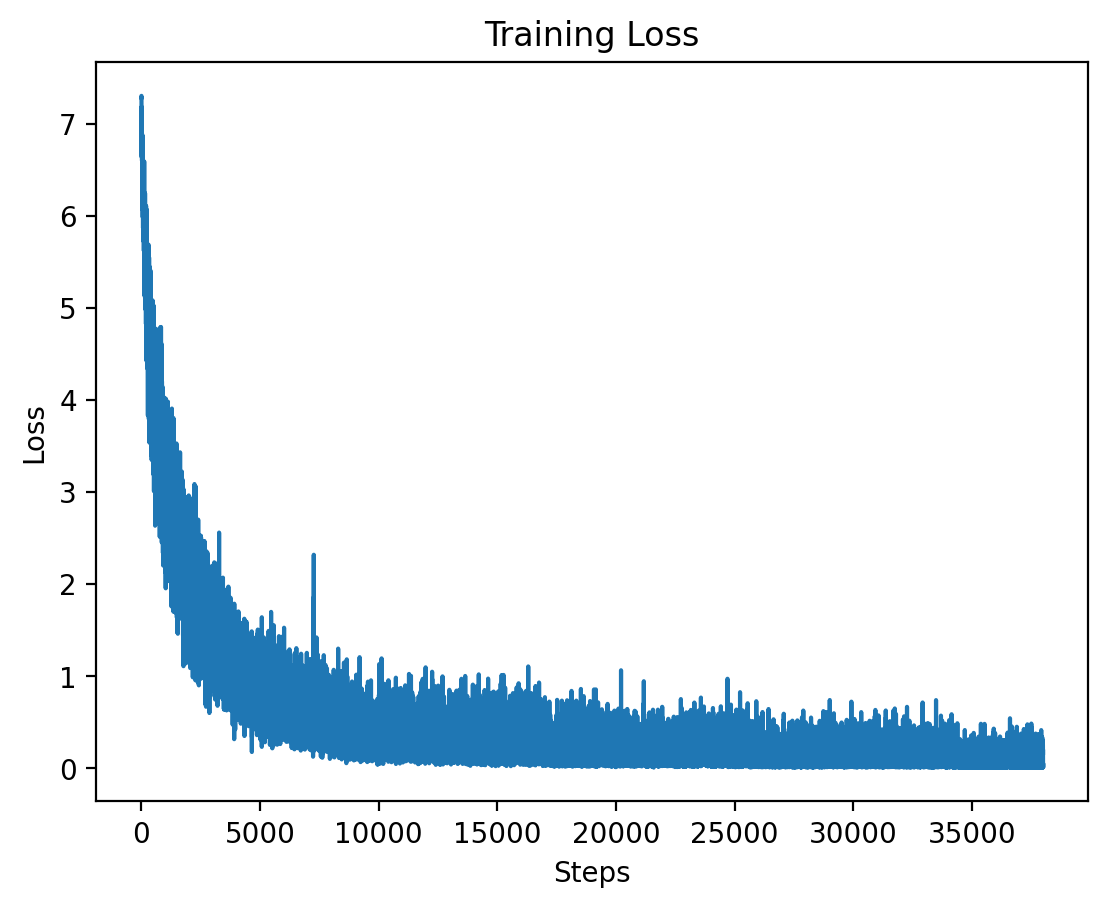
### Level 1: Training Loss |
|
 |
|
This graph shows the training loss over the steps for Level 1, demonstrating a significant drop in loss during the initial training period. |
|
|
|
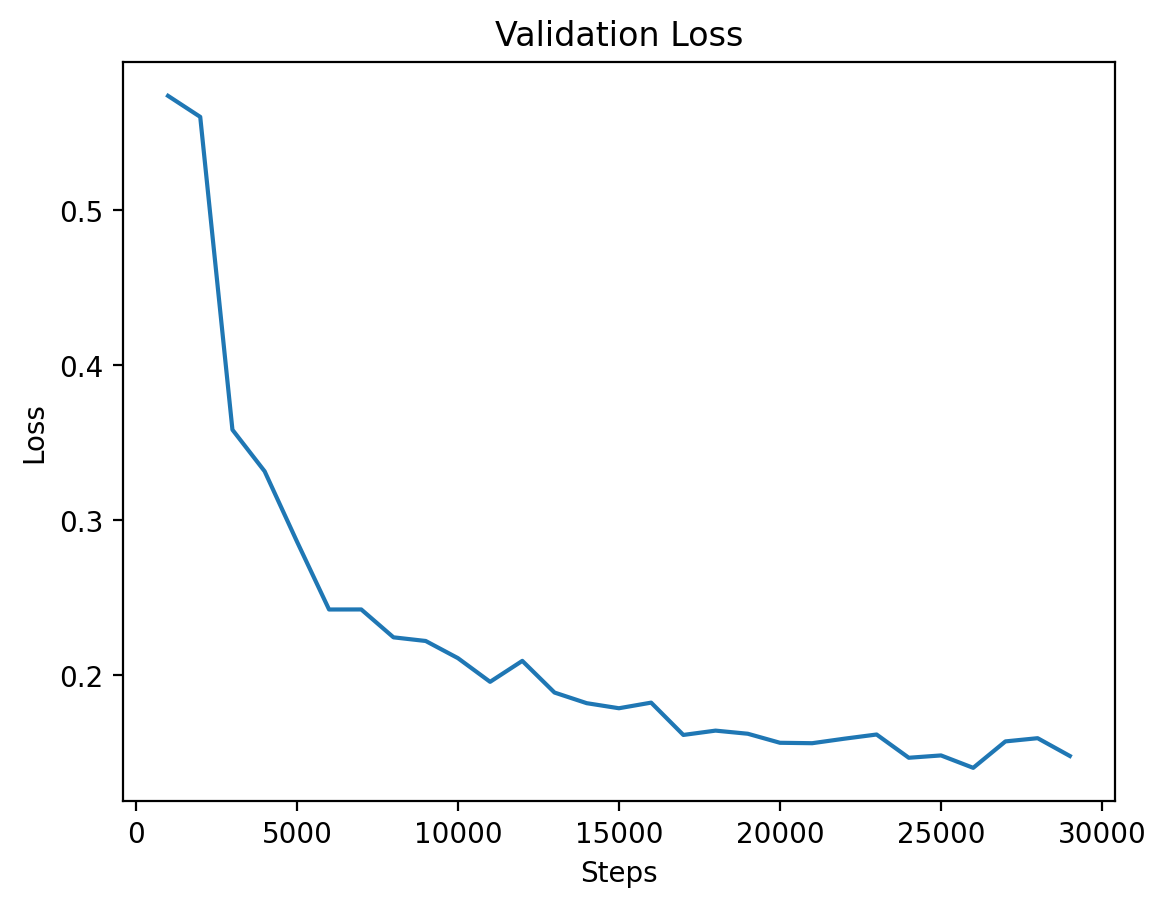
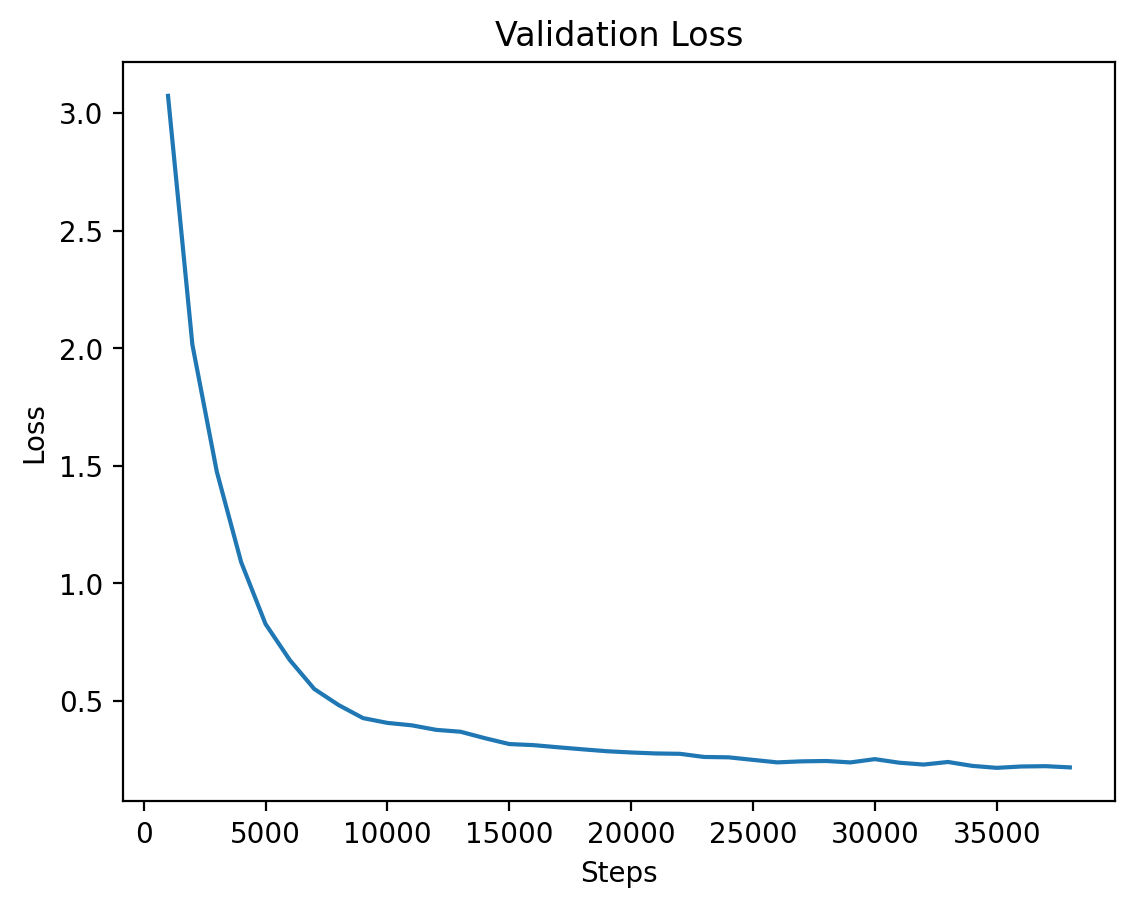
### Level 1: Validation Loss |
|
 |
|
This graph illustrates the validation loss progression over training steps for Level 1, showing steady improvement. |
|
|
|
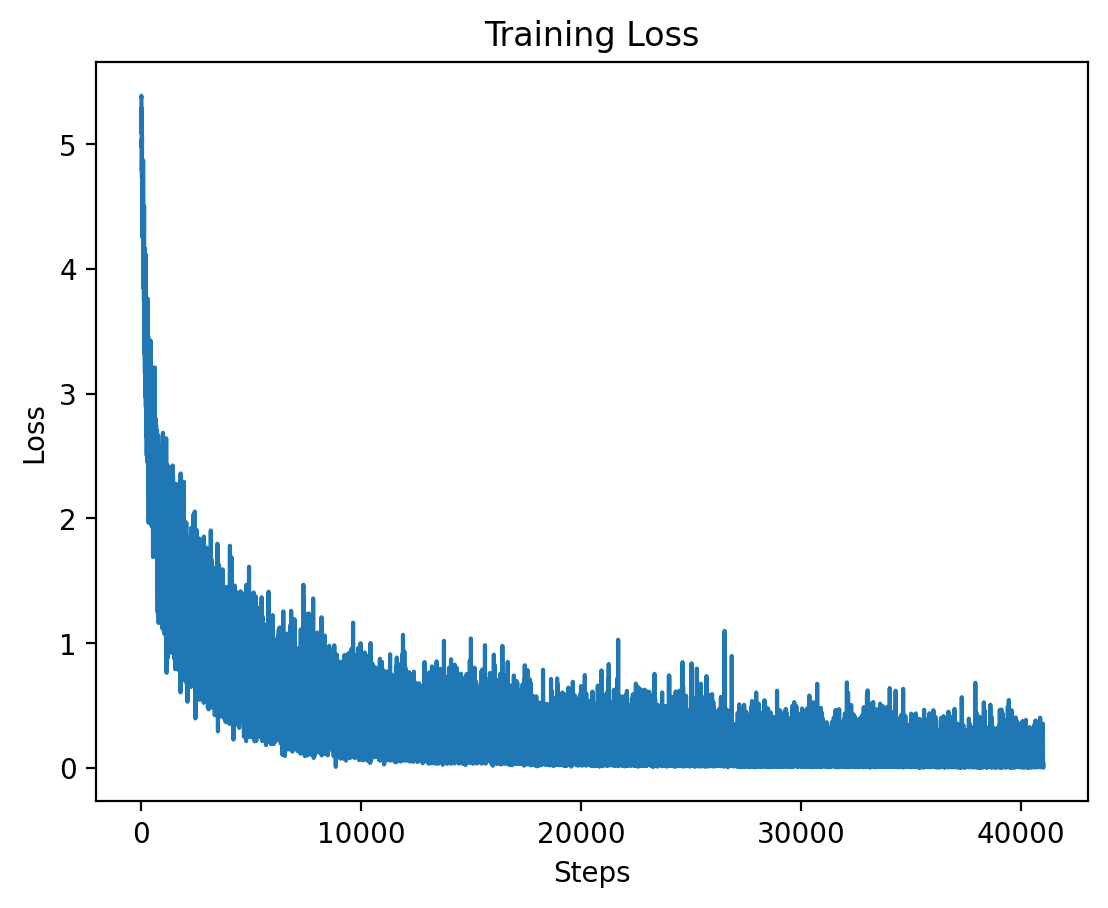
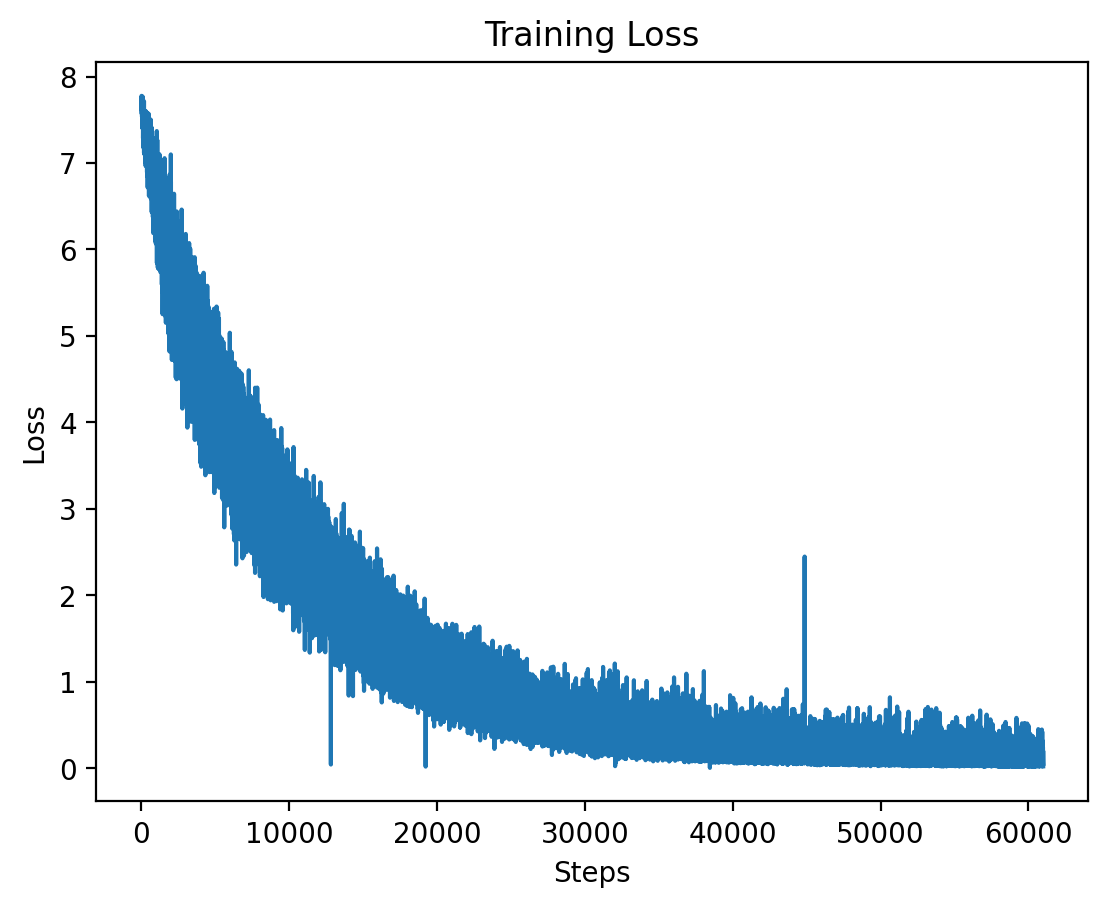
### Level 2: Training Loss |
|
 |
|
Here we see the training loss for Level 2, which also shows a significant decrease early on in training. |
|
|
|
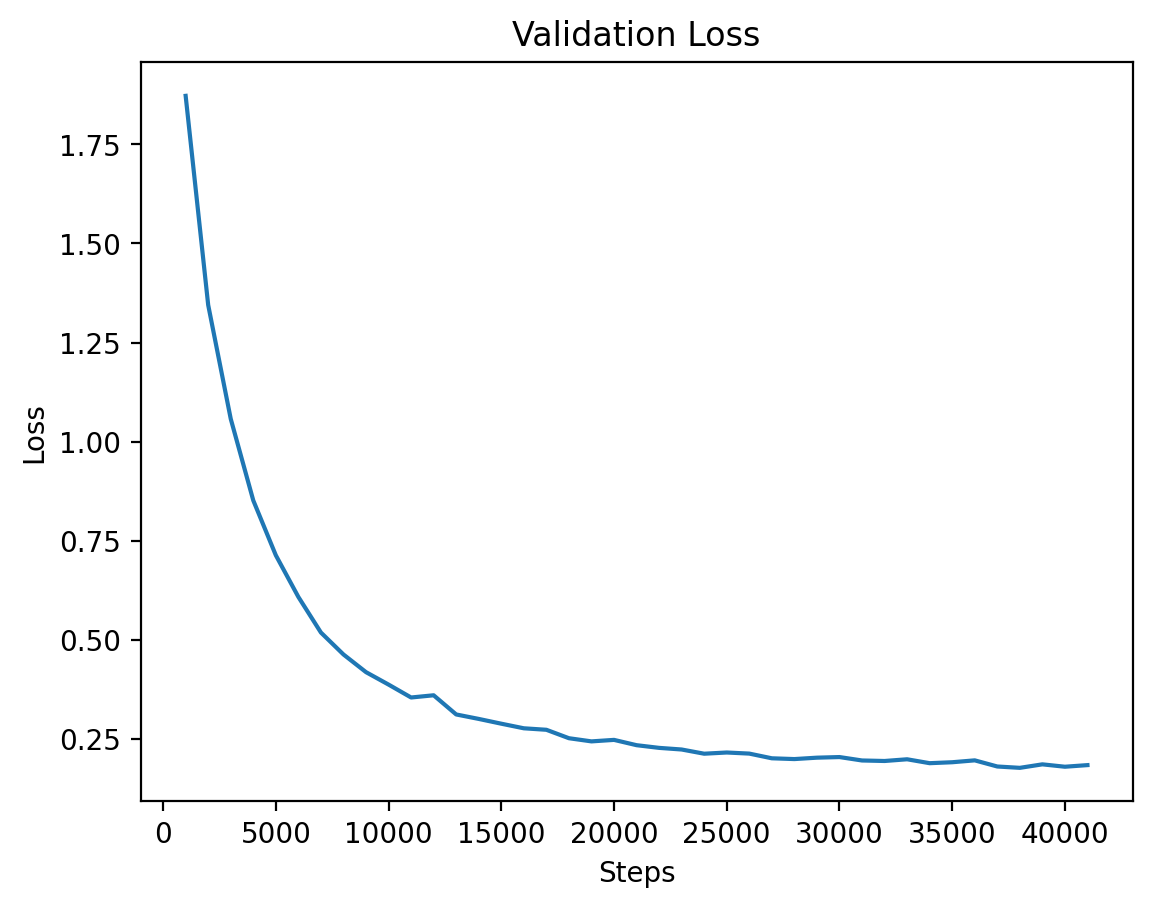
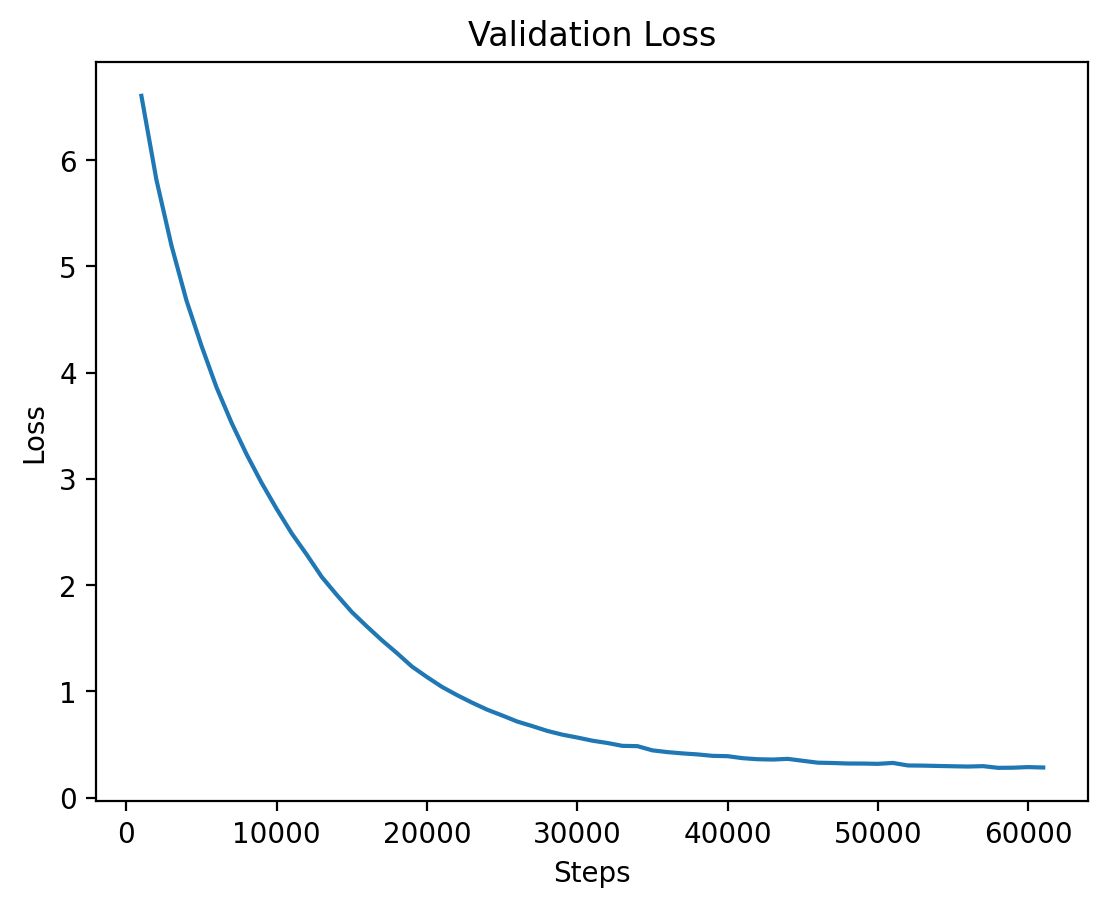
### Level 2: Validation Loss |
|
 |
|
The validation loss for Level 2 shows consistent reduction as training progresses. |
|
|
|
### Level 3: Training Loss |
|
 |
|
This graph displays the training loss for Level 3, where training stabilizes after an initial drop. |
|
|
|
### Level 3: Validation Loss |
|
 |
|
The validation loss for Level 3, demonstrating steady improvements as the model converges. |
|
|
|
## Level 4 |
|
|
|
### Level 4: Training Loss |
|
 |
|
The training loss for Level 4 is plotted here, showing the effects of high-dimensional input features at this level. |
|
|
|
### Level 4: Validation Loss |
|
 |
|
Finally, the validation loss for Level 4 is shown, where training seems to stabilize after a longer period. |
|
|
|
### Level 4: Validation Loss Per Epoch Table |
|
| Epoch | Average Training Loss | |
|
|-------|------------------------| |
|
| 1 | 5.2803 | |
|
| 2 | 2.8285 | |
|
| 3 | 1.5707 | |
|
| 4 | 0.8696 | |
|
| 5 | 0.5164 | |
|
| 6 | 0.3384 | |
|
| 7 | 0.2408 | |
|
| 8 | 0.1813 | |
|
| 9 | 0.1426 | |
|
|
|
## Level 5 |
|
|
|
| Epoch | Average Training Loss | |
|
|-------|-----------------------| |
|
| 1 | 5.9700 | |
|
| 2 | 3.9396 | |
|
| 3 | 2.5609 | |
|
| 4 | 1.6004 | |
|
| 5 | 1.0196 | |
|
| 6 | 0.6372 | |
|
| 7 | 0.4410 | |
|
| 8 | 0.3169 | |
|
| 9 | 0.2389 | |
|
| 10 | 0.1895 | |
|
| 11 | 0.1635 | |
|
| 12 | 0.1232 | |
|
| 13 | 0.1075 | |
|
| 14 | 0.0939 | |
|
| 15 | 0.0792 | |
|
| 16 | 0.0632 | |
|
| 17 | 0.0549 | |
|
|
