
File size: 8,451 Bytes
c3b2d22 dd2b9e9 c2b9741 c3b2d22 dd2b9e9 c761c3e c3b2d22 dd2b9e9 92519ea dd2b9e9 96e3772 dd2b9e9 c2b9741 dd2b9e9 c81f10d b48a8a3 d29c7f8 b48a8a3 d29c7f8 07644b3 94c06c8 760a92f 94c06c8 760a92f 94c06c8 7e5d602 07644b3 94c06c8 |
1 2 3 4 5 6 7 8 9 10 11 12 13 14 15 16 17 18 19 20 21 22 23 24 25 26 27 28 29 30 31 32 33 34 35 36 37 38 39 40 41 42 43 44 45 46 47 48 49 50 51 52 53 54 55 56 57 58 59 60 61 62 63 64 65 66 67 68 69 70 71 72 73 74 75 76 77 78 79 80 81 82 83 84 85 86 87 88 89 90 91 92 93 94 95 96 97 98 99 100 101 102 103 104 105 106 107 108 109 110 111 112 113 114 115 116 117 118 119 120 121 122 123 124 125 126 127 128 129 130 131 132 133 134 135 136 137 138 139 140 141 142 143 144 145 146 147 148 149 150 151 152 153 154 155 156 157 158 159 160 161 162 163 164 165 166 167 168 169 170 171 172 173 174 175 176 177 178 179 180 181 182 183 184 185 186 187 188 189 190 191 |
---
language: en
tags:
- transformers
- text-classification
- taxonomy
license: other
license_name: link-attribution
license_link: https://dejanmarketing.com/link-attribution/
model_name: Taxonomy Classifier
pipeline_tag: text-classification
base_model: albert-base-v2
---
# Taxonomy Classifier
This model is a hierarchical text classifier designed to categorize text into a 7-level taxonomy. It utilizes a chain of models, where the prediction at each level informs the prediction at the subsequent level. This approach reduces the classification space at each step.
## Model Details
- **Model Developers:** [DEJAN.AI](https://dejan.ai/)
- **Model Type:** Hierarchical Text Classification
- **Base Model:** [`albert/albert-base-v2`](https://huggingface.co/albert/albert-base-v2)
- **Taxonomy Structure:**
| Level | Unique Classes |
|---|---|
| 1 | 21 |
| 2 | 193 |
| 3 | 1350 |
| 4 | 2205 |
| 5 | 1387 |
| 6 | 399 |
| 7 | 50 |
- **Model Architecture:**
- **Level 1:** Standard sequence classification using `AlbertForSequenceClassification`.
- **Levels 2-7:** Custom architecture (`TaxonomyClassifier`) where the ALBERT pooled output is concatenated with a one-hot encoded representation of the predicted ID from the previous level before being fed into a linear classification layer.
- **Language(s):** English
- **Library:** [Transformers](https://huggingface.co/docs/transformers/index)
- **License:** [link-attribution](https://dejanmarketing.com/link-attribution/)
## Uses
### Direct Use
The model is intended for categorizing text into a predefined 7-level taxonomy.
### Downstream Uses
Potential applications include:
- Automated content tagging
- Product categorization
- Information organization
### Out-of-Scope Use
The model's performance on text outside the domain of the training data or for classifying into taxonomies with different structures is not guaranteed.
## Limitations
- Performance is dependent on the quality and coverage of the training data.
- Errors in earlier levels of the hierarchy can propagate to subsequent levels.
- The model's performance on unseen categories is limited.
- The model may exhibit biases present in the training data.
- The reliance on one-hot encoding for parent IDs can lead to high-dimensional input features at deeper levels, potentially impacting training efficiency and performance (especially observed at Level 4).
## Training Data
The model was trained on a dataset of 374,521 samples. Each row in the training data represents a full taxonomy path from the root level to a leaf node.
## Training Procedure
- **Levels:** Seven separate models were trained, one for each level of the taxonomy.
- **Level 1 Training:** Trained as a standard sequence classification task.
- **Levels 2-7 Training:** Trained with a custom architecture incorporating the predicted parent ID.
- **Input Format:**
- **Level 1:** Text response.
- **Levels 2-7:** Text response concatenated with a one-hot encoded vector of the predicted ID from the previous level.
- **Objective Function:** CrossEntropyLoss
- **Optimizer:** AdamW
- **Learning Rate:** Initially 5e-5, adjusted to 1e-5 for Level 4.
- **Training Hyperparameters:**
- **Epochs:** 10
- **Validation Split:** 0.1
- **Validation Frequency:** Every 1000 steps
- **Batch Size:** 38
- **Max Sequence Length:** 512
- **Early Stopping Patience:** 3
## Evaluation
Validation loss was used as the primary evaluation metric during training. The following validation loss trends were observed:
- **Level 1, 2, and 3:** Showed a relatively rapid decrease in validation loss during training.
- **Level 4:** Exhibited a slower decrease in validation loss, potentially due to the significant increase in the dimensionality of the parent ID one-hot encoding and the larger number of unique classes at this level.
Further evaluation on downstream tasks is recommended to assess the model's practical performance.
## How to Use
Inference can be performed using the provided Streamlit application.
1. **Input Text:** Enter the text you want to classify.
2. **Select Checkpoints:** Choose the desired checkpoint for each level's model. Checkpoints are saved in the respective `level{n}` directories (e.g., `level1/model` or `level4/level4_step31000`).
3. **Run Inference:** Click the "Run Inference" button.
The application will output the predicted ID and the corresponding text description for each level of the taxonomy, based on the provided `mapping.csv` file.
## Visualizations
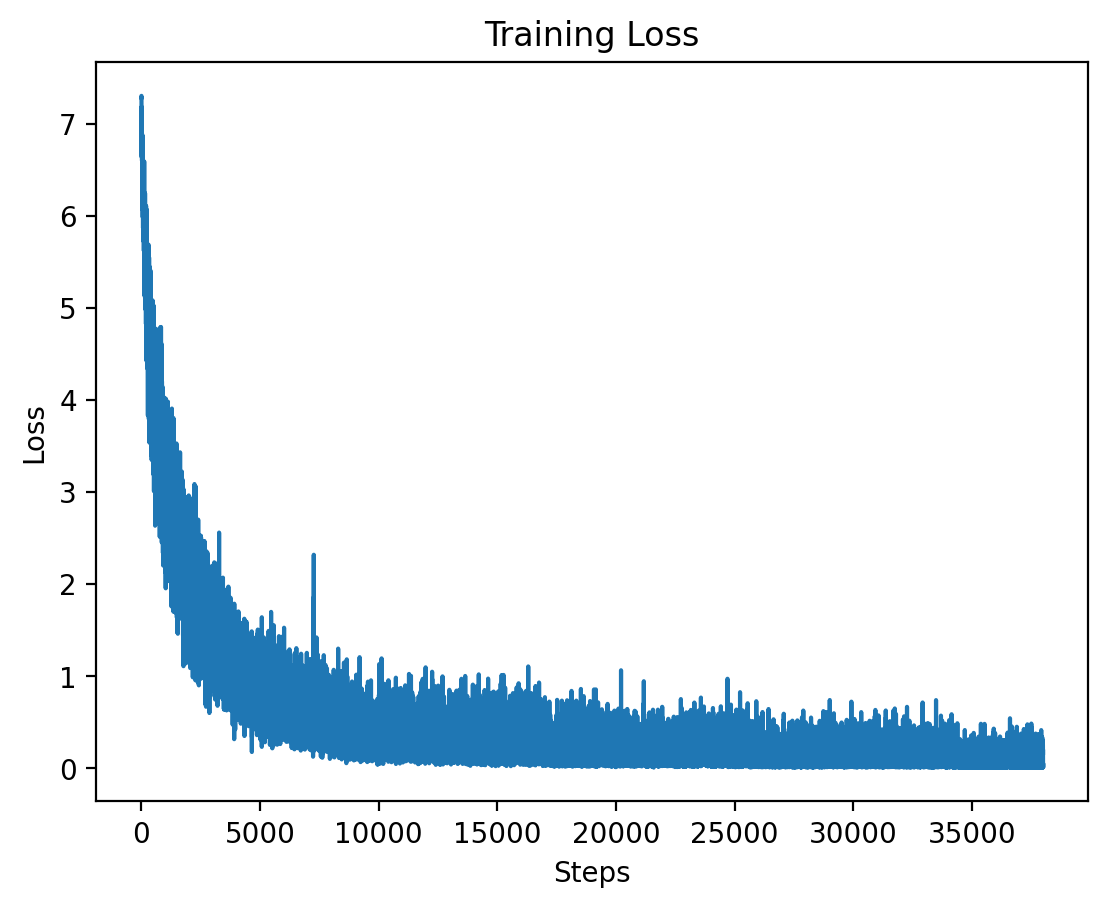
### Level 1: Training Loss
This graph shows the training loss over the steps for Level 1, demonstrating a significant drop in loss during the initial training period.
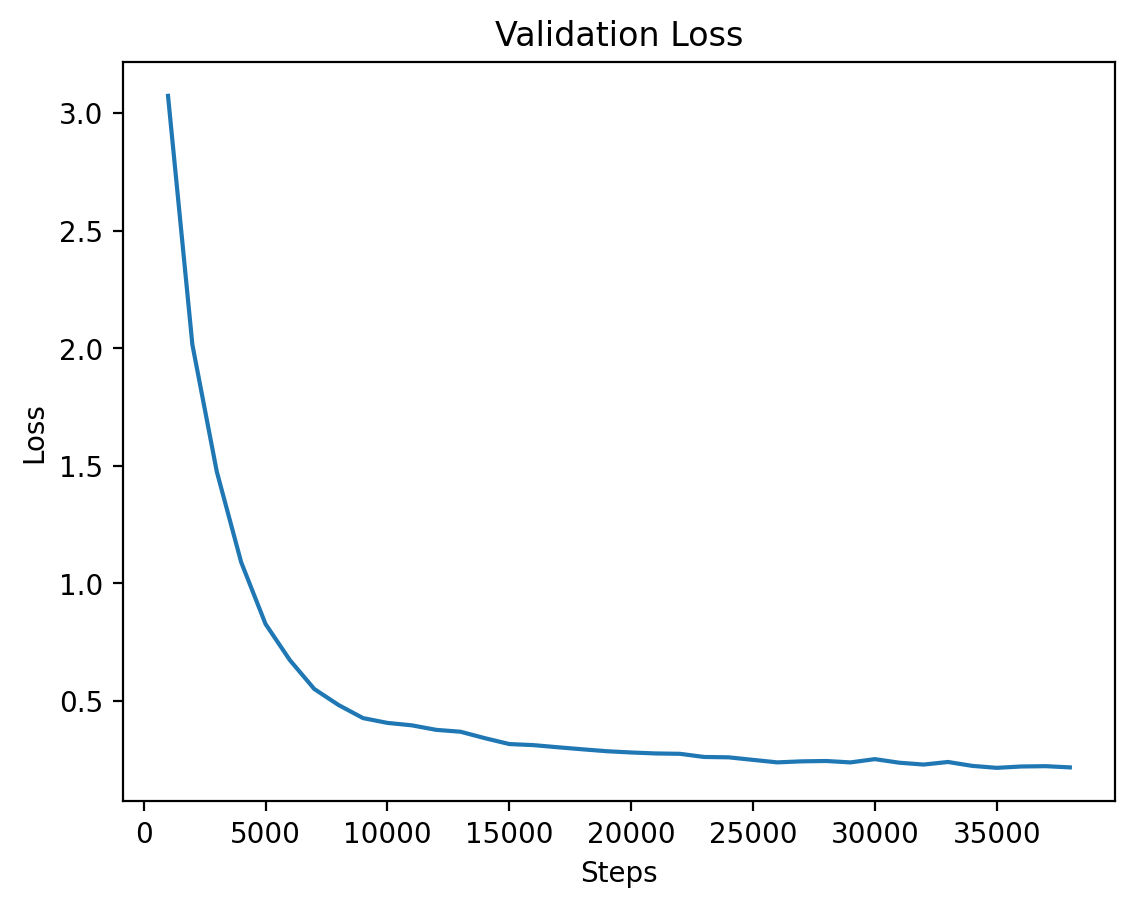
### Level 1: Validation Loss
This graph illustrates the validation loss progression over training steps for Level 1, showing steady improvement.
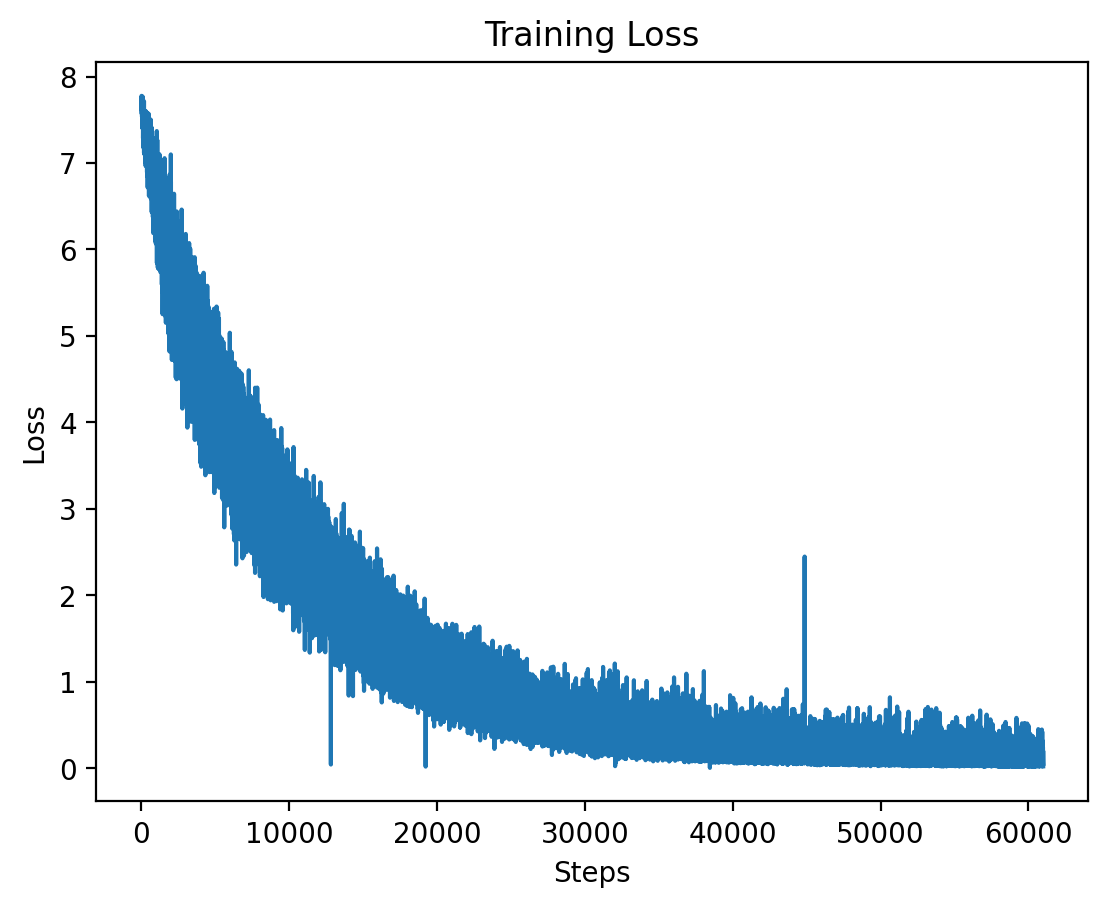
### Level 2: Training Loss
Here we see the training loss for Level 2, which also shows a significant decrease early on in training.
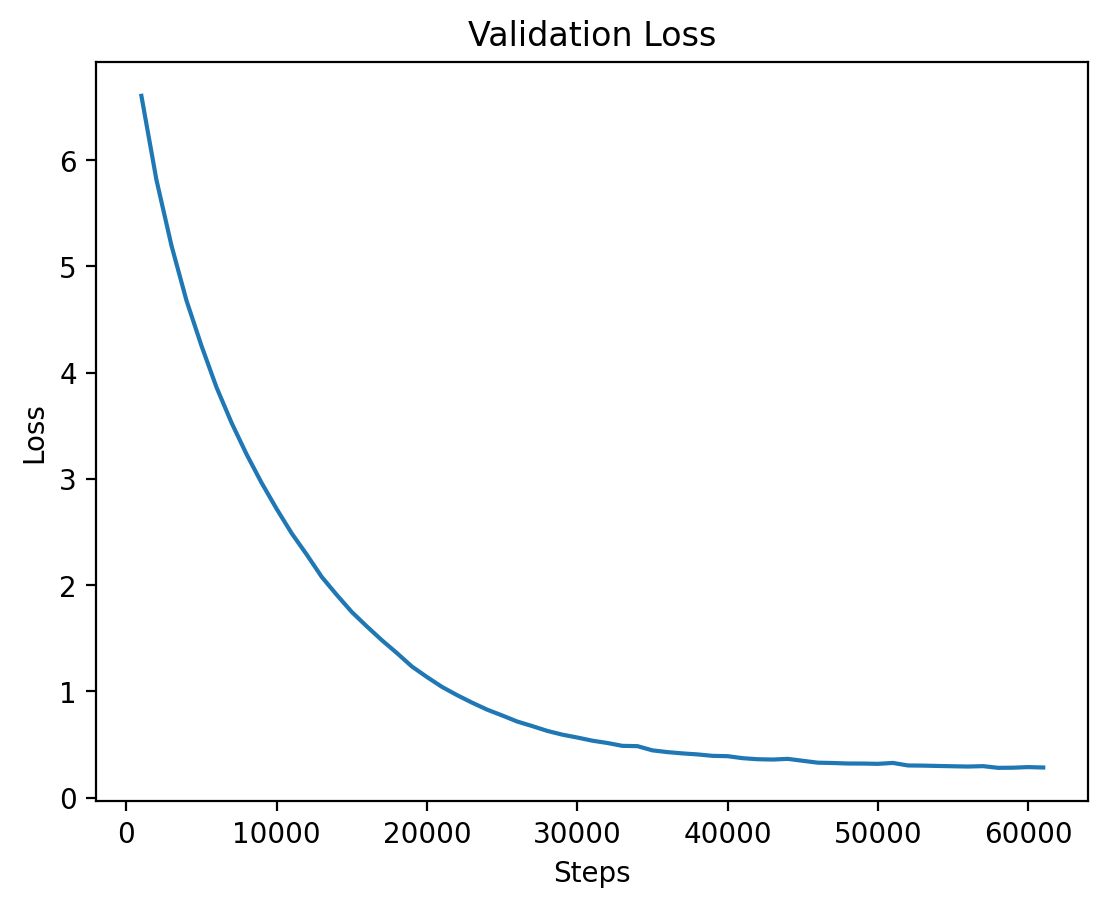
### Level 2: Validation Loss
The validation loss for Level 2 shows consistent reduction as training progresses.
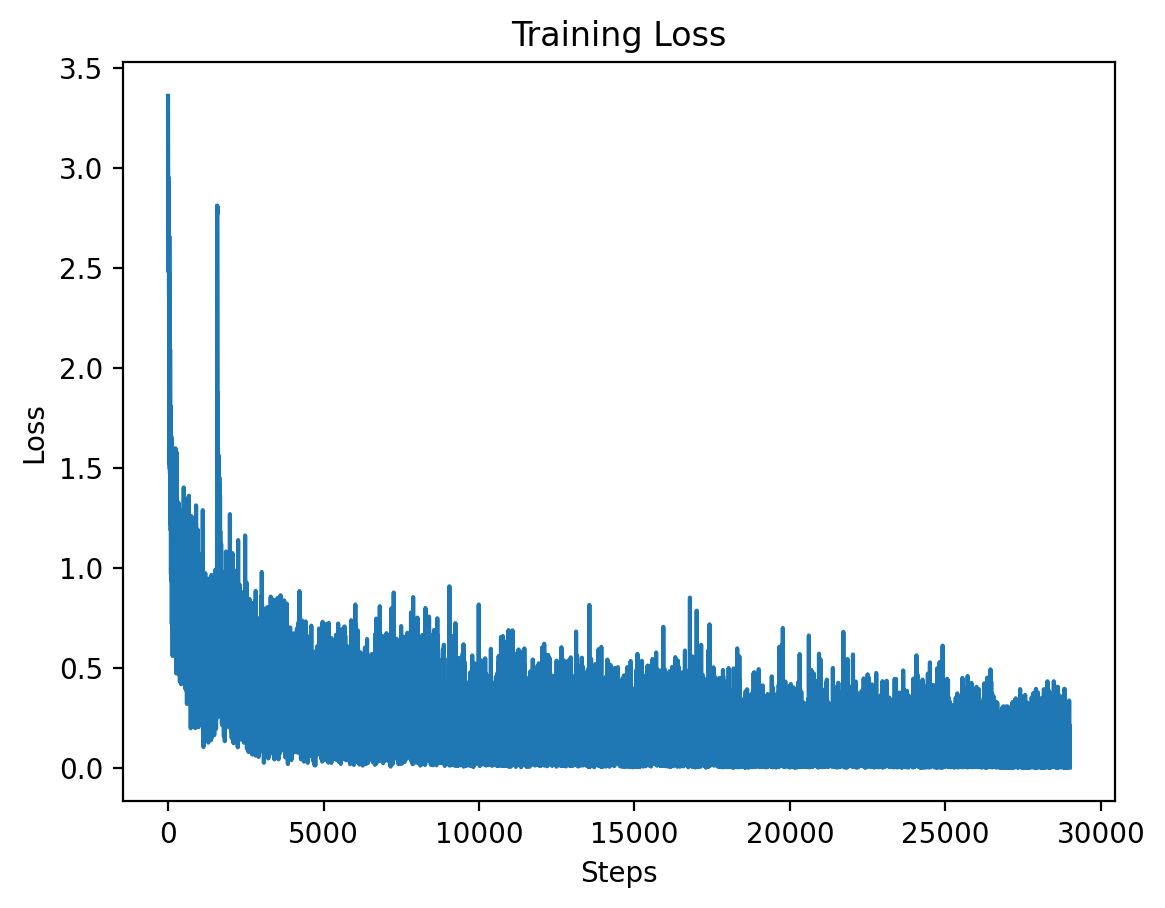
### Level 3: Training Loss
This graph displays the training loss for Level 3, where training stabilizes after an initial drop.
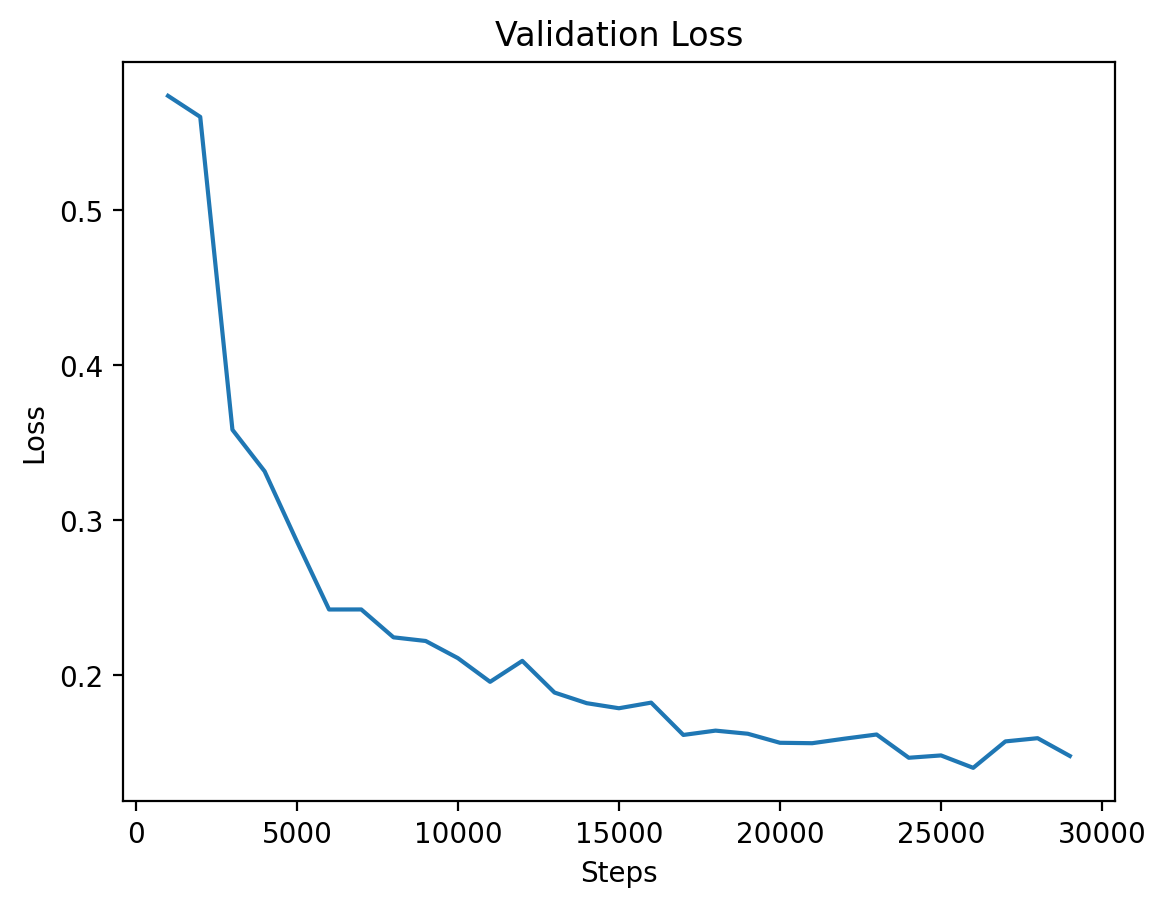
### Level 3: Validation Loss
The validation loss for Level 3, demonstrating steady improvements as the model converges.
## Level 4
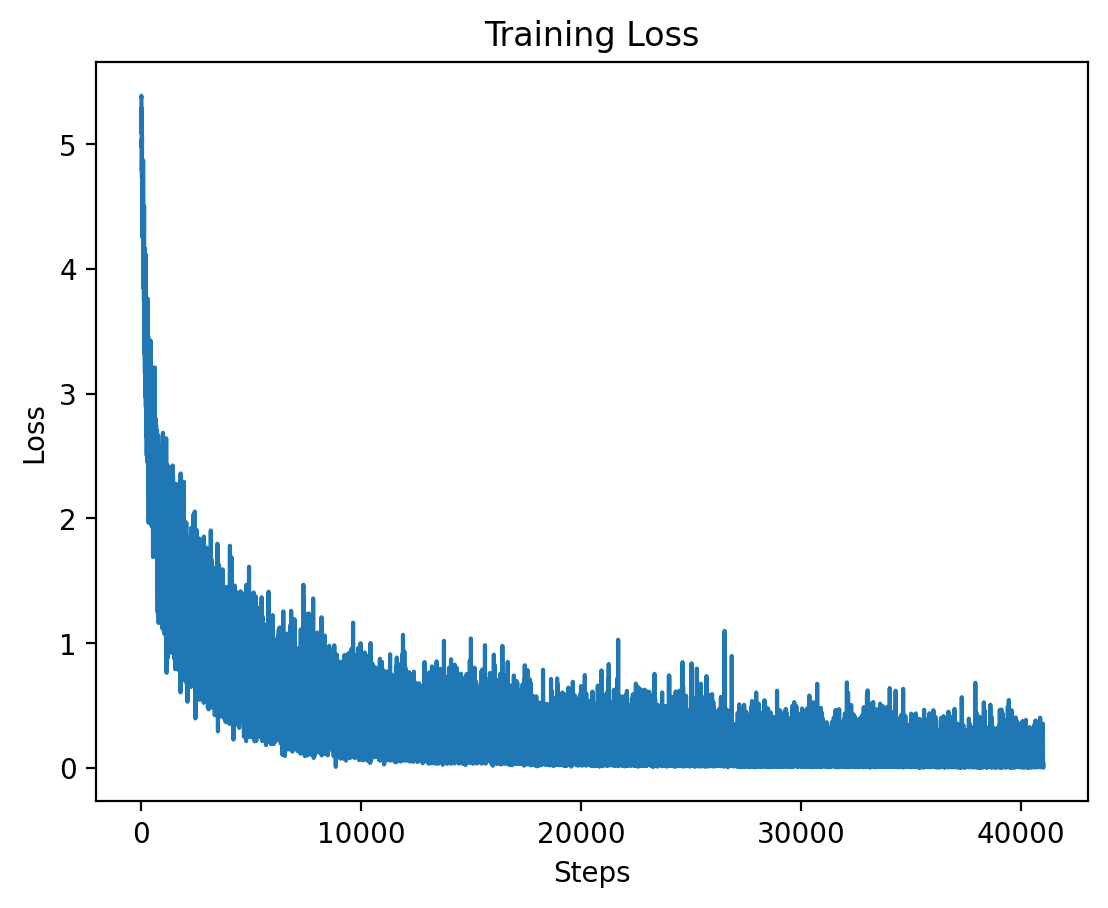
### Level 4: Training Loss
The training loss for Level 4 is plotted here, showing the effects of high-dimensional input features at this level.
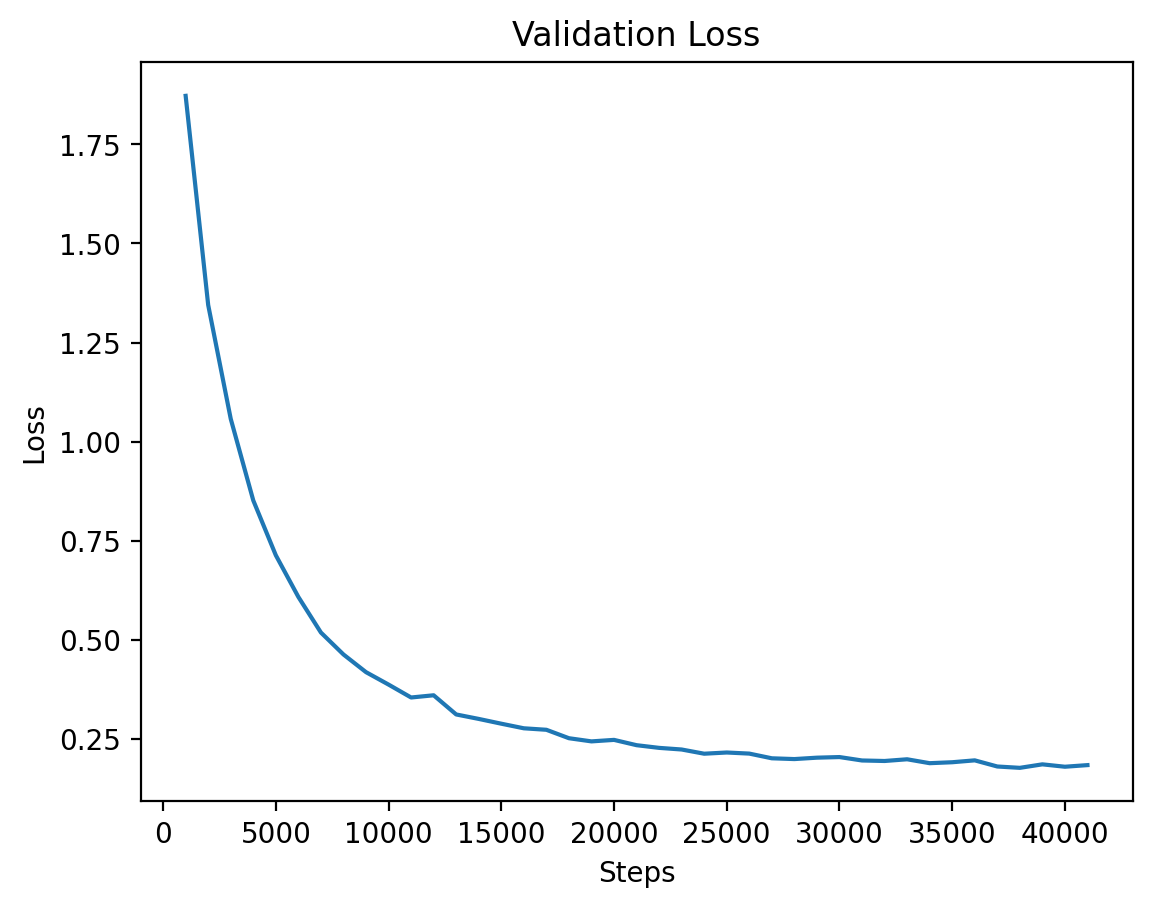
### Level 4: Validation Loss
Finally, the validation loss for Level 4 is shown, where training seems to stabilize after a longer period.
### Level 4: Validation Loss Per Epoch Table
| Epoch | Average Training Loss |
|-------|------------------------|
| 1 | 5.2803 |
| 2 | 2.8285 |
| 3 | 1.5707 |
| 4 | 0.8696 |
| 5 | 0.5164 |
| 6 | 0.3384 |
| 7 | 0.2408 |
| 8 | 0.1813 |
| 9 | 0.1426 |
## Level 5
### Level 5: Training and Validation Loss
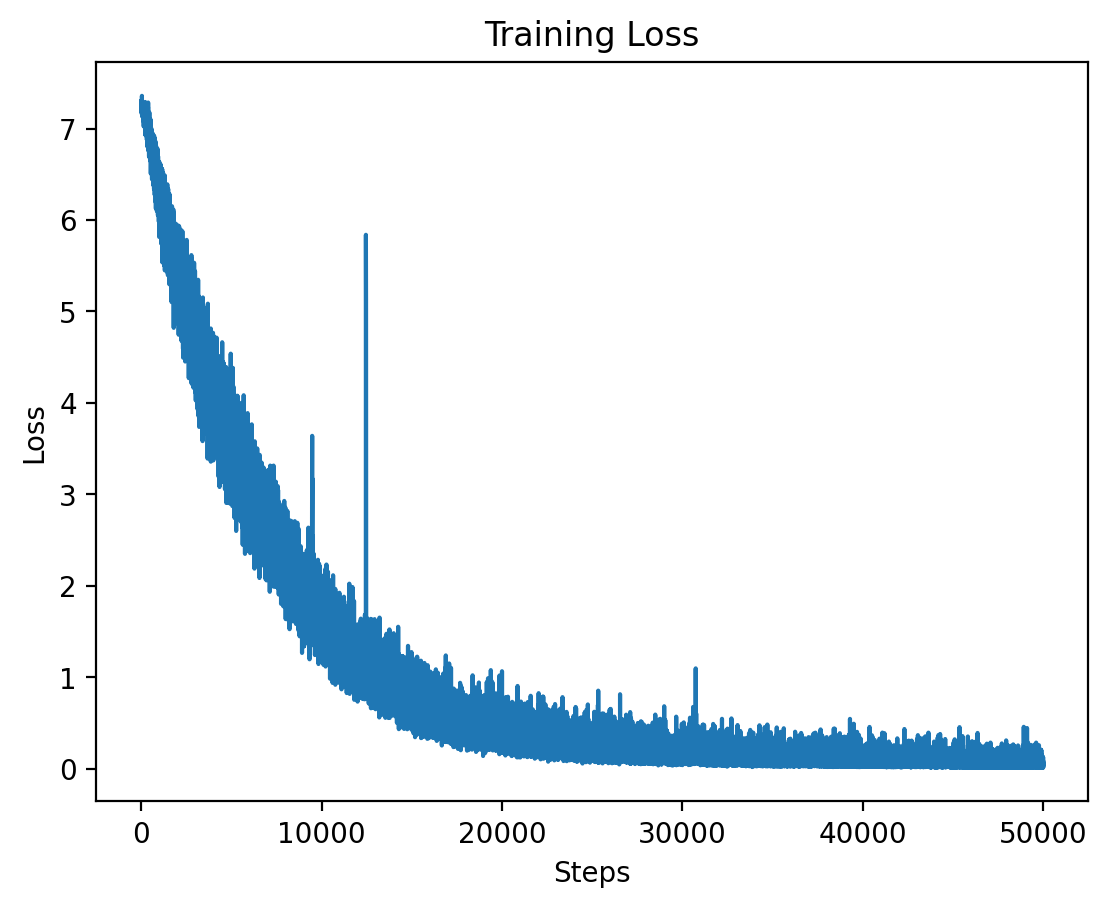
Level 5 training loss.
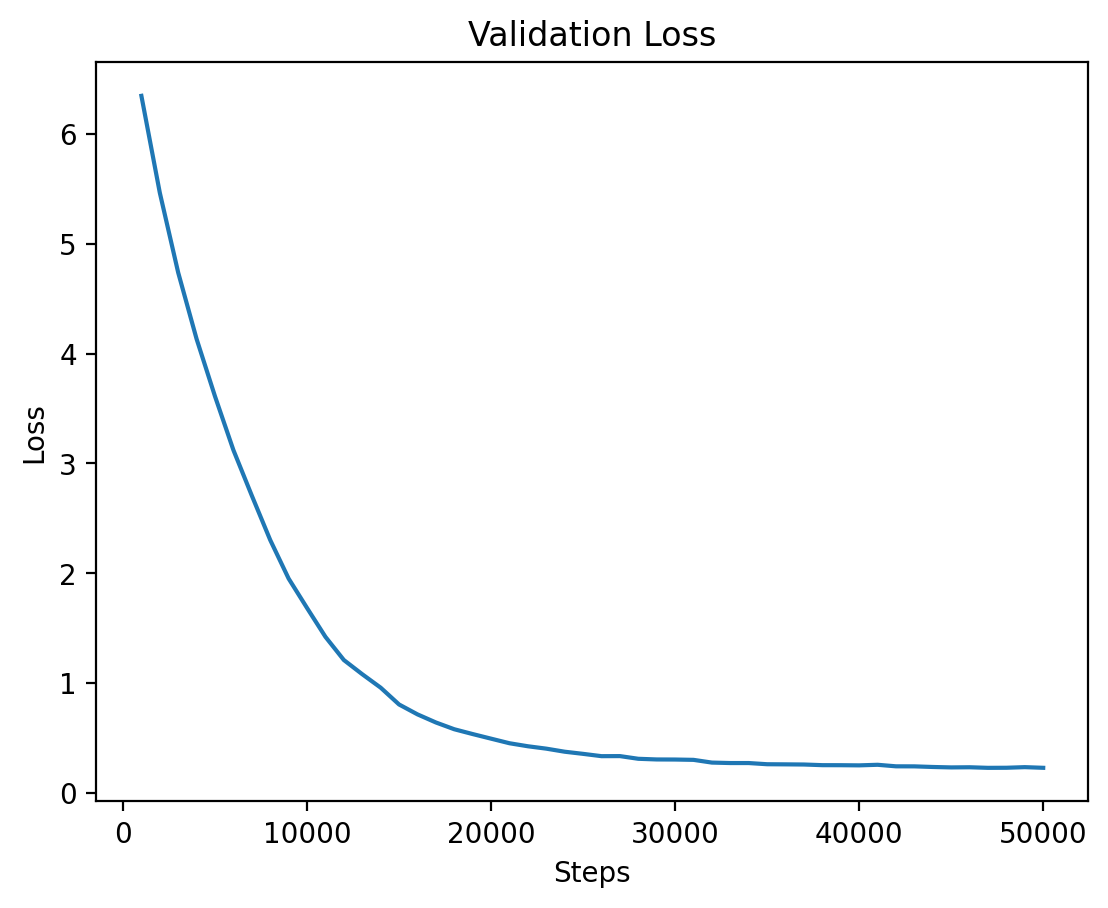
Level 5 validation loss.
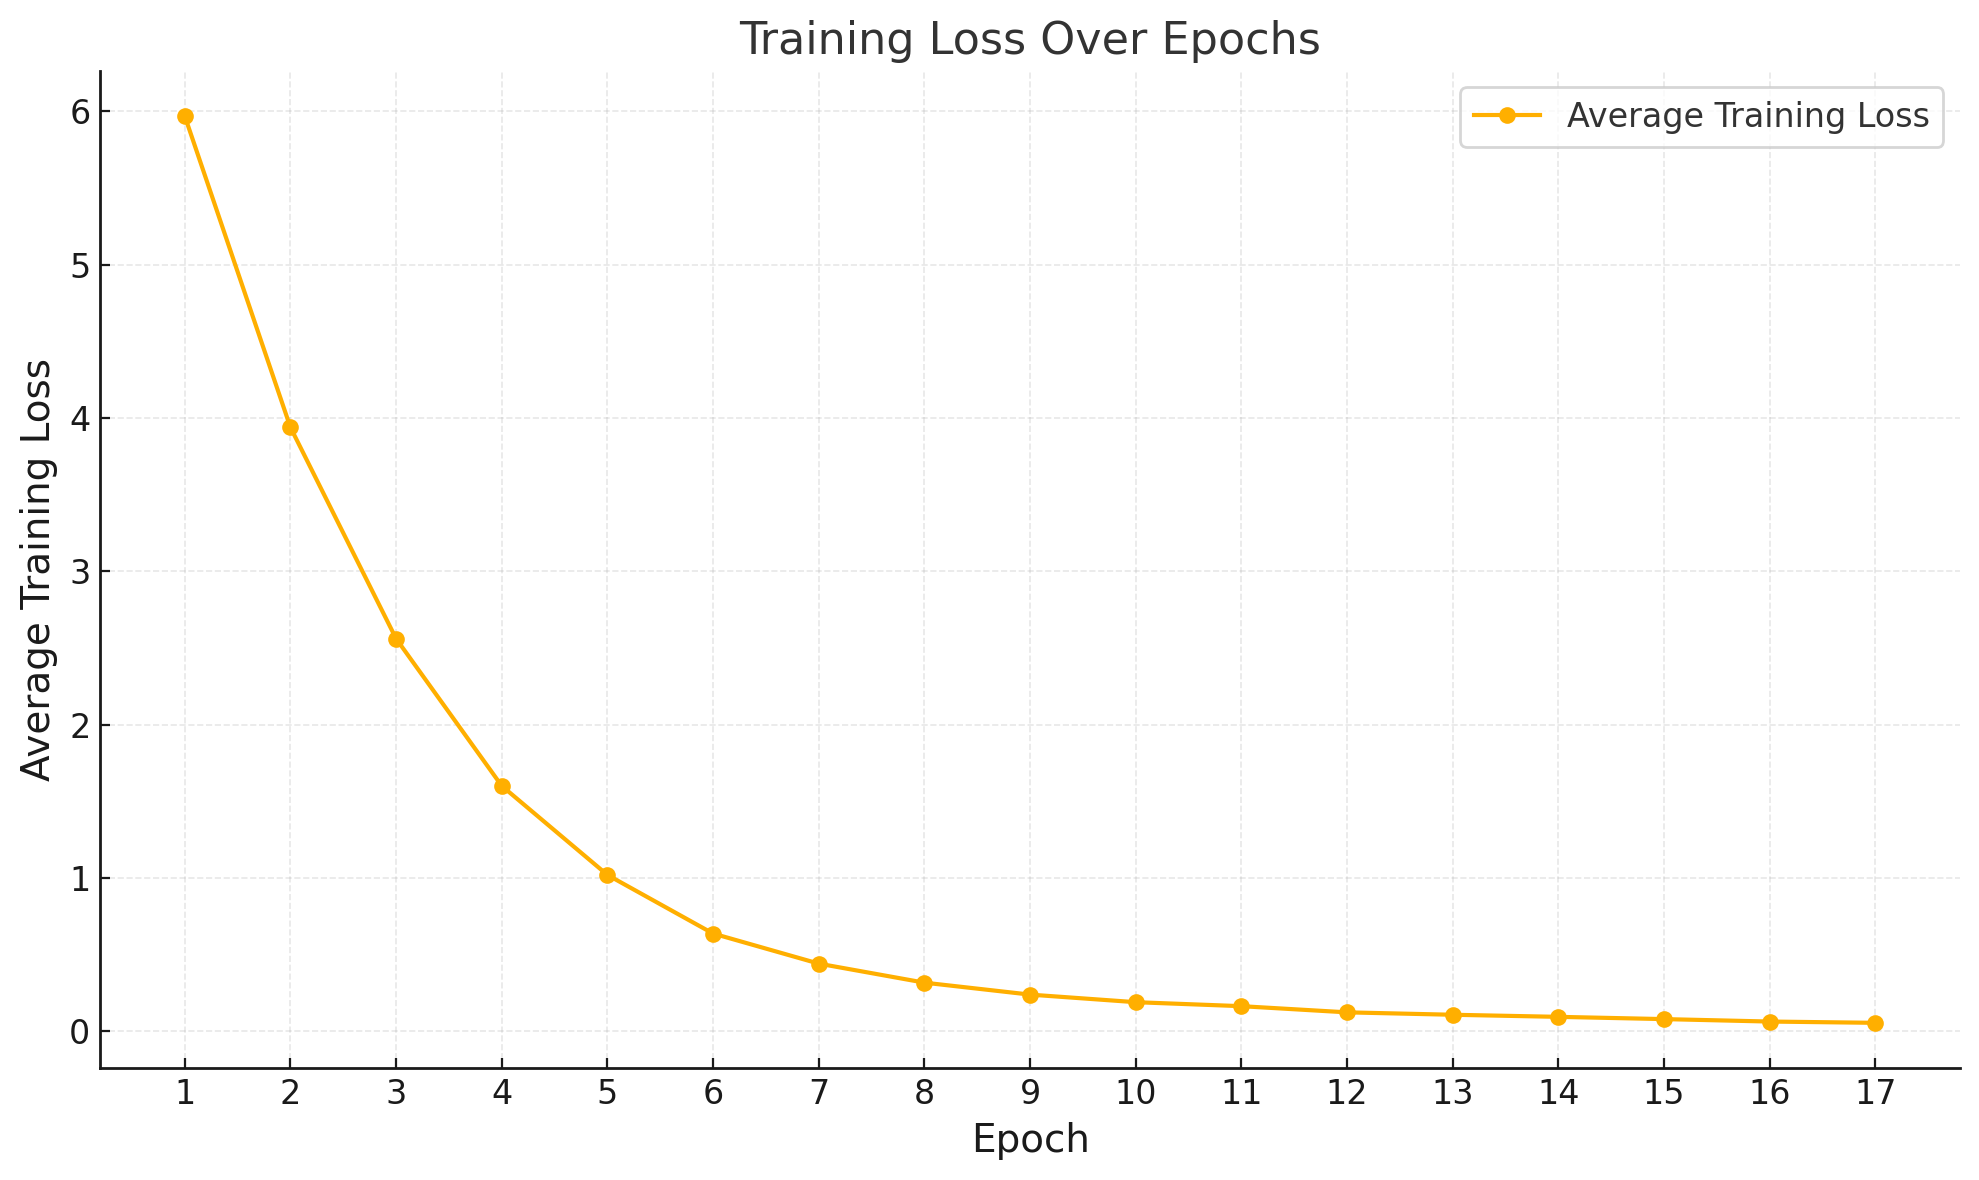
Average training loss / epoch.
### Level 5: Training Loss Per Epoch Table
| Epoch | Average Training Loss |
|-------|-----------------------|
| 1 | 5.9700 |
| 2 | 3.9396 |
| 3 | 2.5609 |
| 4 | 1.6004 |
| 5 | 1.0196 |
| 6 | 0.6372 |
| 7 | 0.4410 |
| 8 | 0.3169 |
| 9 | 0.2389 |
| 10 | 0.1895 |
| 11 | 0.1635 |
| 12 | 0.1232 |
| 13 | 0.1075 |
| 14 | 0.0939 |
| 15 | 0.0792 |
| 16 | 0.0632 |
| 17 | 0.0549 | |